

AI Scribes Only Help If You’re Bad at Clinical Documenting
New UCSF study pours cold water on the AI scribe hype

Welcome to AI Health Uncut, a brutally honest newsletter on AI, innovation, and the state of the healthcare market. If you’d like to sign up to receive issues over email, you can do so here.
I read a bunch of newly published papers over the weekend, and I thought this one, out of the University of California, San Francisco, was the most relevant to my readers and to the industry:

Keep in mind that most of the numbers I present here are NOT in the paper. The paper is an important foundation for my analysis, and I’m confident the authors would agree that these extension results follow naturally from their work.
But first, two upcoming events I was invited to speak at:

If you are in Philadelphia on Tuesday, February 17, don’t be a stranger. Register for Health2Tech, where I’ll be speaking.

I will also be speaking at the Digital Health and AI Innovation Summit (DHAI) 2026 in Boston on June 8-9. Register here.
At both events, I’ll be talking about my newly developed methodology for measuring VC skill in picking “generational companies.” It’s based on a unique dataset of 190 publicly traded health tech companies and 700 investment firms that invested in them. It’s a dataset I tediously built over the past several months. And unlike the Forbes annual ranking, I’m using performance metrics, not some subjective “perception of greatness.” 😉
I’ll explain more about this dataset in future posts. I also plan to offer free access to it for my Founding Members.
Alright, back to AI scribes and slow physician-documenters...
First, let me give you my main result, my main table, and how I got there.
Then I’ll walk through the setup and other results from the UCSF study, which I think are also super interesting for the industry.
Key Result:
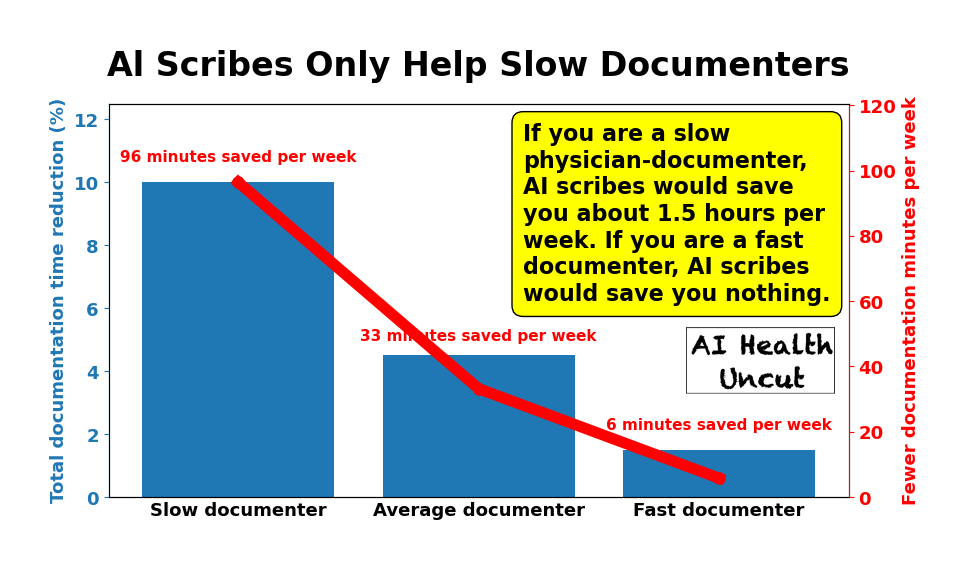
If you are a slow physician-documenter, AI scribes would save you about 1.5 hours per week, or about 10% of your current documentation load. If you are an efficient documenter, AI scribes would save you basically nothing.
Key Table:
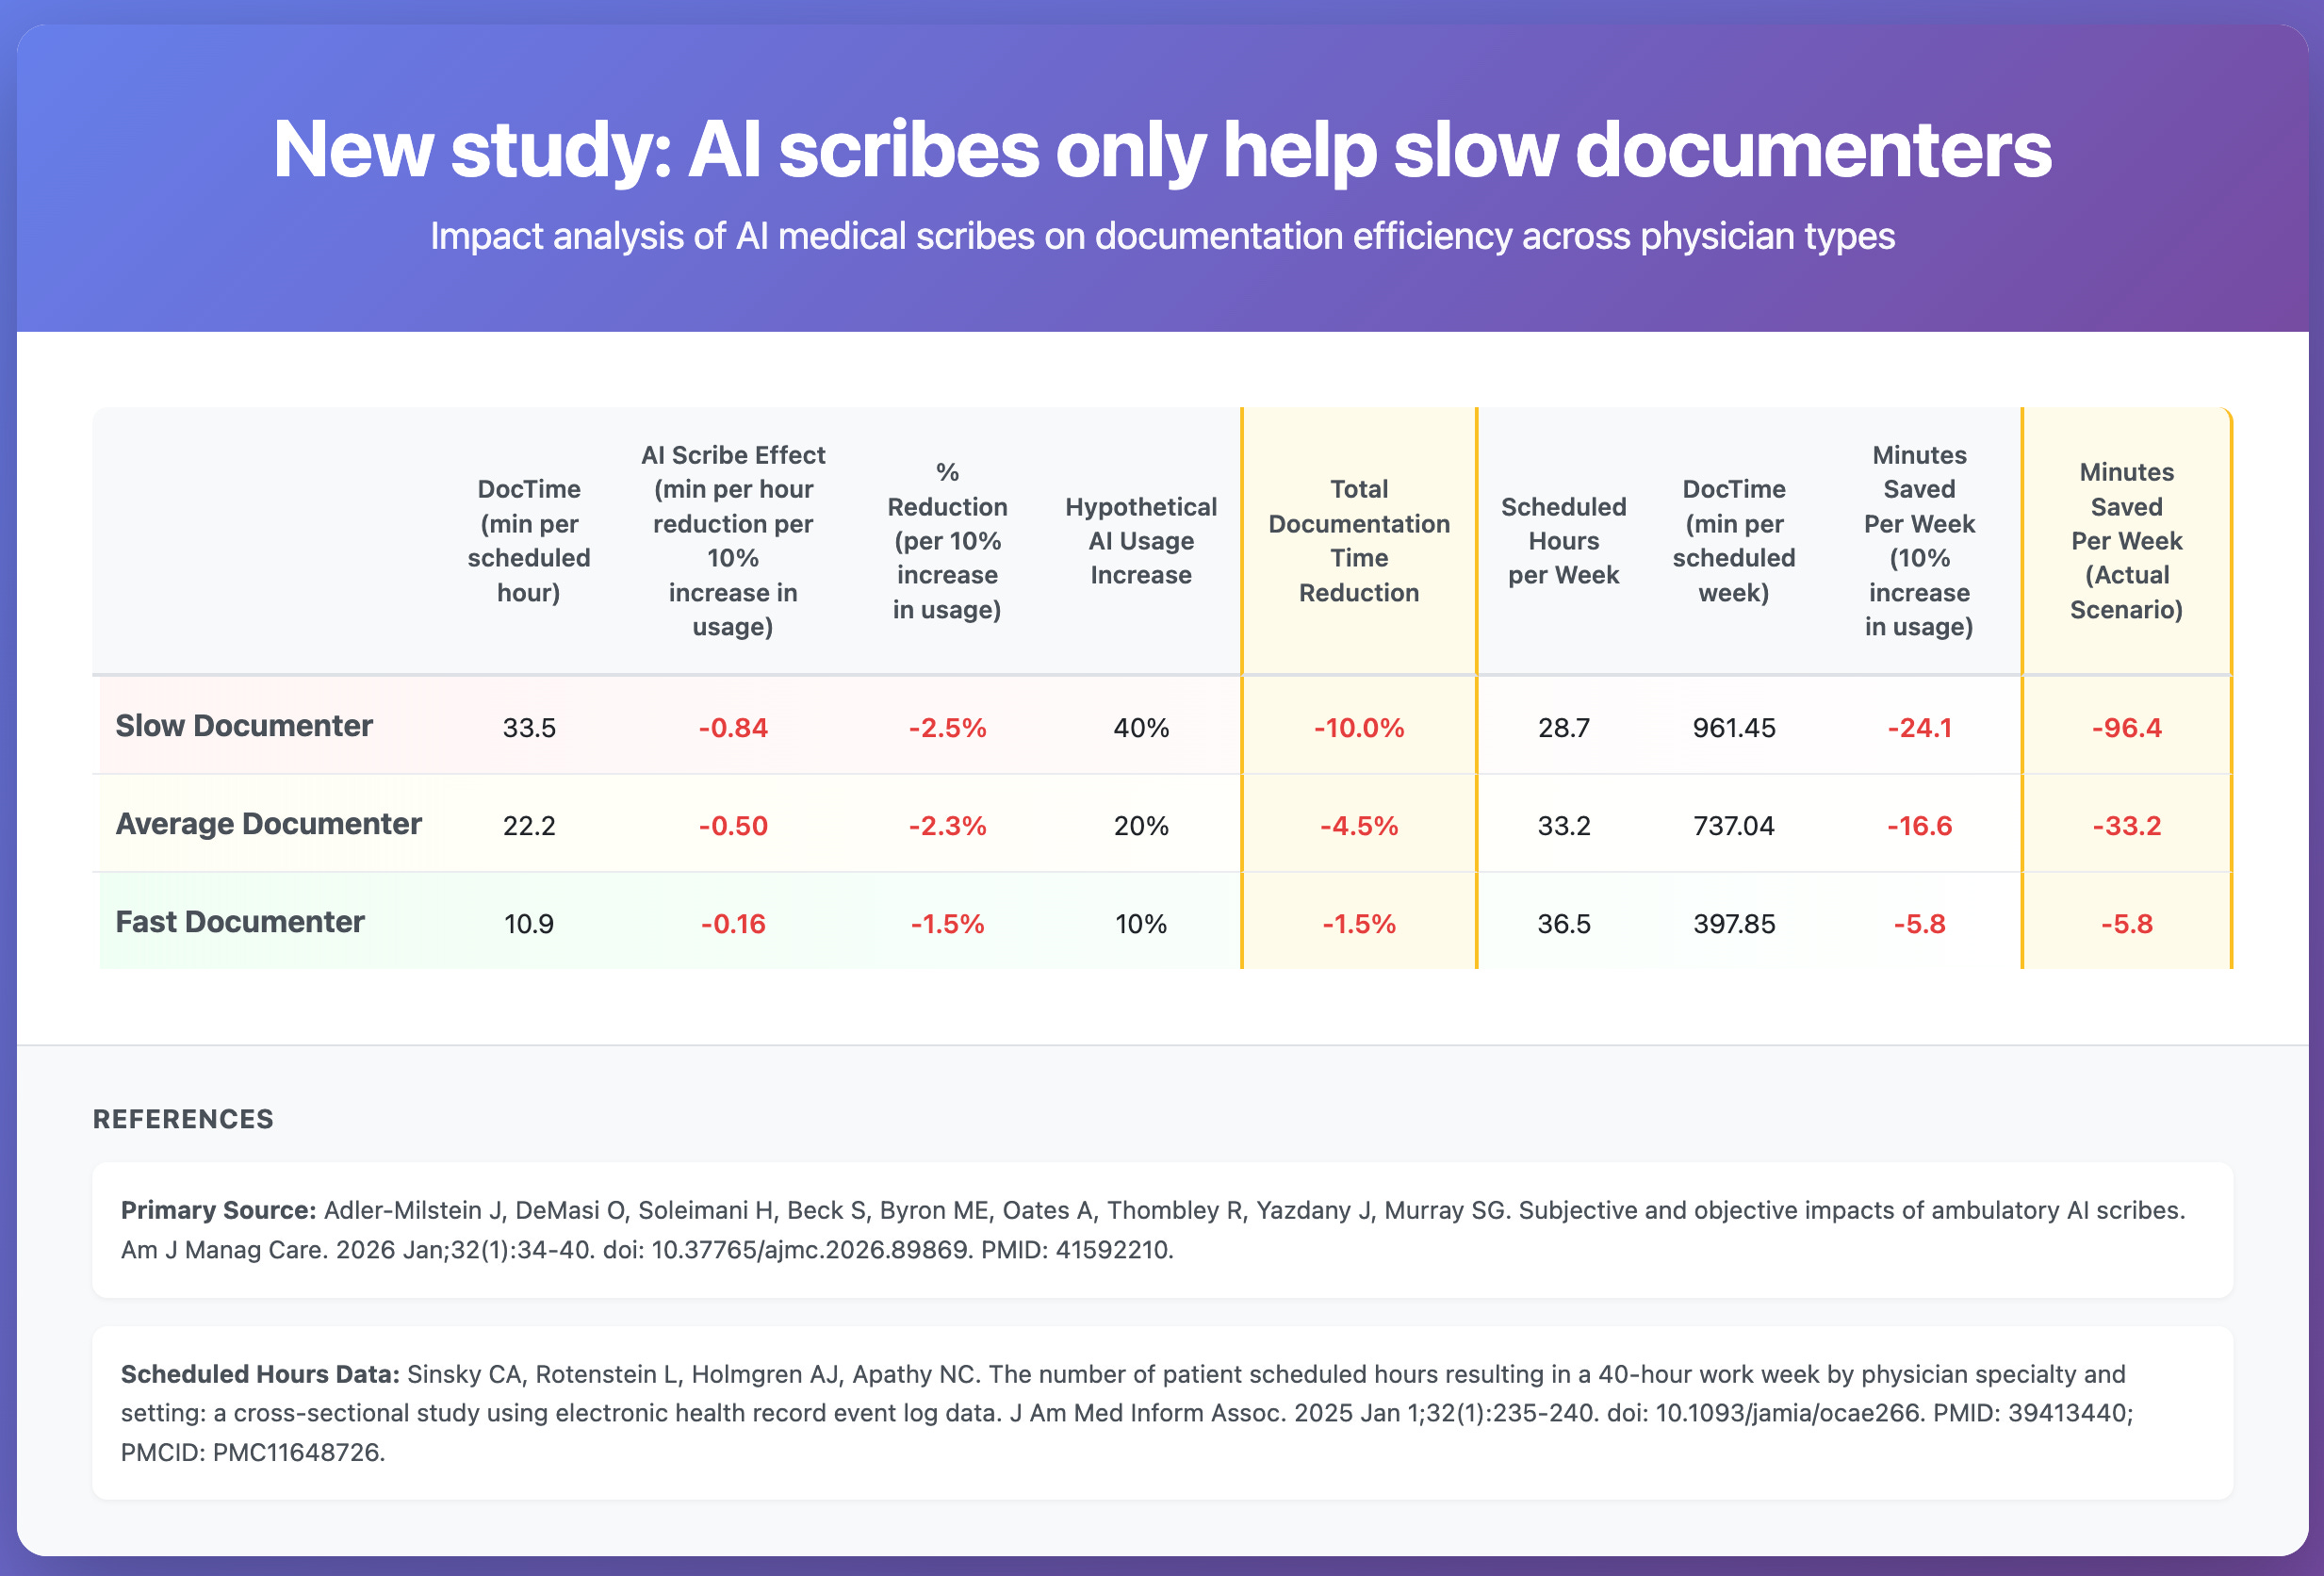
Let’s go through the table, because it’s important to understand exactly how I arrived at these results.
Definition of a slow vs. fast (efficient) physician documenter (of clinical notes).
Average Documenter: Always the intercept (mean) of a corresponding regression. For example, from Table 1, average documentation time DocTime (minutes per scheduled hour) is 22.2.
Slow Documenter: One standard deviation from the mean (+1 std for DocTime, -1 std for efficiency)
Fast Documenter: One standard deviation from the mean (-1 std for DocTime, +1 std for efficiency)
Column 1: DocTime (min per scheduled hour)
This is straight from Table 1 of the paper:
Physician baseline DocTime ≈ 22.2 − (baseline DocTime efficiency), where 1 standard deviation of baseline DocTime efficiency = 11.3 min per scheduled hour.
Column 2: Al Scribe Effect (min per hour reduction per 10% increase in usage)
Average Documenter:
From Table 3 model 1, each additional 10% of encounters using the AI scribe is associated with 0.5 fewer DocTime minutes per scheduled hour (slope coefficient of percentage of weekly visits using AI scribe times 10.)
Slow Documenter:
Table 3, model 3, DocTime change from AI scribe use
= [ (–0.05) + (0.003) × (Baseline efficiency) ] × (AI scribe use)
where
(–0.05) + (0.003) × (Baseline efficiency) is marginal effect per +1 percentage point
Now from Table 1, standard deviation of baseline DocTime efficiency is 11.3.
For “slow” (or “less efficient”) physician-documenter, baseline efficiency is –11.3 (notice negative sign).
So marginal marginal effect per 10% AI scribe usage increase, for “slow” documenter:
= ( –0.05 + 0.003 × (–11.3) ) x 10 = -0.839
Fast Documenter:
For “fast” (or “more efficient”) physician-documenter, baseline efficiency is +11.3 (notice negative sign).
So marginal marginal effect per 10% AI scribe usage increase, for “slow” documenter:
= ( –0.05 + 0.003 × 11.3 ) x 10 = -0.161
Column 3: Percent Reduction (per 10% increase in usage)
To get the percent reduction due to AI scribes (per 10% increase in AI scribe usage), we divide the value in Column 2 by the value in Column 1.
Column 4: Hypothetical Al Usage Increase
This is up for discussion. These values are calibrated based on available research, which unfortunately does not provide these estimates directly. Still, we can reasonably approximate them.
The research strongly confirms my qualitative expectation that inefficient, slow documenters would see the largest average increase in AI scribe use. For tech-savvy and efficient documenters, AI scribes would not deliver the same marginal gains in efficiency.
The evidence supports my hypothesis:
UCSF study under consideration (AJMC 2026): Significant interaction effect (P<.001) in Table 3 showing inefficient documenters realized the majority of time savings from AI scribes.
Kaiser Permanente (NEJM Catalyst 2025): The top third of physicians by baseline documentation burden accounted for 89% of all AI scribe activations - demonstrating they self-selected into high usage because they had the most to gain.
Peterson Health Technology Institute (March 2025): Noted “clinicians who saw the greatest benefit were those who had not yet optimized their documentation workflows, were consistently behind in notes.”
UCLA RCT (NEJM AI 2025) - Lukac et al. found that in dose-response relationship (r = −0.41), higher users got more benefit.
Mayo Clinic Abridge Study (Nov 2025): Non-adopters had used transcription at 3.7x the rate of eventual adopters - suggesting those with existing efficient workarounds were less likely to adopt.
So efficient documenters who are already fast and tech-savvy have less marginal benefit to capture, so lower adoption makes economic sense. The inefficient documenters have the largest efficiency gap to close, hence the highest adoption.
The missing piece in the literature is just the precise quantification of my estimates.
Column 5: Total Documentation Time Reduction
It’s the value in Column 3, scaled by the assumed increase in AI usage in Column 4.
Column 6: Scheduled Hours per Week
To estimate scheduled clinic hours in a week, I used an estimate of patient scheduled hours within a 40-hour work week for ambulatory physicians, published in the Journal of the American Medical Informatics Association last year.
As expected, more efficient documenters generally have more patient scheduled hours.
Column 7: DocTime (min per scheduled week)
Documentation minutes per scheduled week is the number of documentation minutes per scheduled hour (Column 1) multiplied by scheduled hours per week (Column 6).
Column 8: Minutes Saved Per Week (10% increase in usage)
Minutes saved per week per 10% increase in usage is the hourly effect (Column 2) multiplied by scheduled hours per week (Column 6).
Column 9: Minutes Saved Per Week (Actual Scenario)
Finally, to estimate actual minutes saved per week, I scale the minutes saved per week per 10% increase in usage (Column 8) by the assumed increase in AI usage (Column 4).
Notice that inefficient physician-documenters benefit by a wide margin from AI scribe usage, despite having fewer scheduled clinic hours per week.
The UCSF Study Setup
Setting. University of California, San Francisco ambulatory specialty practices at a large academic medical center in Northern California that delivers more than 2 million patient visits annually.
Tool. A commercial AI scribe, Ambience AutoScribe from Ambience Healthcare, integrated into the EHR. Clinicians used it on a smartphone after getting patient consent, including for telemedicine visits. (Special shoutout to the Ambience team, which scored highly in my Ranking of the 50 Top AI Scribes.)
How many doctors. 310 attending ambulatory physicians who were onboarded between December 6, 2024 and February 9, 2025. That was 18.7% of an estimated 1658 eligible physicians.
How many doctors answered the survey. 252 physicians completed the post-adoption survey (81.3% of the 310).
How many visits. The paper does not report a single total count of patient visits or encounters for the analytic sample. It analyzes data at the physician-week level and includes “total weekly visits” as a covariate, but it does not publish a total visit number in the main tables.
How many observation-weeks. In Table 1, they report 2764 physician-weeks in the pre period and 3055 physician-weeks in the post period. In the regression models (weeks with more than 1 ambulatory encounter), they used 2958 physician-week observations for the full sample models.
Time horizon. Baseline was 12 weeks before onboarding. Post was 12 weeks after a 4-week washout starting the week of onboarding.
Specialties. Multiple ambulatory specialties were included, grouped into nine categories (for example primary care, surgical specialties, neurology and psychiatry, medical specialties). Specialty breakdown is in the eAppendix table.
Data source for time measures. EHR audit logs using Epic Systems active use log data (User Action Log Lite), focused on ambulatory-context EHR activity.
Other Interesting Findings From the UCSF Study
Most doctors felt the AI scribe saved them time. About 86.5% said documentation time decreased after adopting the AI scribe, and only a tiny fraction said it increased. (Table 1.)
But feelings did not match reality in a clean way. The study found no overall link between what doctors reported (big time savings vs small time savings vs no change) and what the EHR logs showed happened to their documentation time. In other words, lots of people felt faster even when measured time did not clearly drop for them. (Table 2 and Figure.)
Why the perception gap might exist. Some clinicians may be getting benefits that feel like time savings (less cognitive load, less dread, less “I have to remember everything later”), even when the measured documentation minutes do not drop much.
Actual time savings existed, but they were modest on average. Documentation time dropped from about 22.2 minutes per scheduled hour before adoption to 17.3 minutes per scheduled hour after adoption. That is an average reduction of about 4.9 minutes per scheduled hour across the pre vs post periods they analyzed. (Table 1.)
Adoption intensity was only “about half” of visits, not close to universal. On average, physicians used the AI scribe in 58.7% of weekly encounters, with huge variation across weeks and clinicians. So even among adopters, many visits still ran without it. (Table 1.)
Work outside of work (pajama time) improved a bit, but not in the same targeted way. “Work outside of work” time (their EHR log measure) fell from about 20.0 to 17.4 minutes per scheduled hour. Higher AI scribe use was associated with slightly lower after-hours EHR time overall, but the “inefficient doc writers benefit more” pattern did not show up clearly for after-hours time. (Table 1 and Table 3.)
Practical implication for ROI. If a health system wants financial return, the best bet is not “give it to everyone and expect miracles.” It is “target and support higher-DocTime clinicians and drive higher usage levels,” because that is where the measurable time savings concentrate.
Why These Results May Not Be 100% Relevant
As Rik Renard recently pointed out in a LinkedIn post about a different, but related, study, maybe the metrics we are using to evaluate AI scribes are wrong. “Measuring AI scribes purely on physician productivity misses the point entirely. The real value, that is hard to study, is a combination of: preventing clinician burnout (perceived value >>), coding/billing and improved documentation (which will lead to better care, especially knowing where AI is going).”
Yes, AI scribes might not be only about documentation. They are also about coding and billing, which is partly enabled by better documentation, but not only.
Industry leaders such as Shiv Rao, CEO of Abridge, would likely agree. For example, on the No Priors podcast on March 27, 2025, he said, “Every single one of these notes is actually a bill.”
I will pose this question again in our Digital Health Inside Out podcast recording with Shiv this week. 😉
Like what you’re reading in this newsletter? Want more in-depth investigations and research like this?
I’m committed to staying independent and unbiased—no sponsors, no advertisers. But that also means I’m a one-man operation with limited resources, and investigations like this take a tremendous amount of effort.
Consider becoming a Founding Member of AI Health Uncut and join the elite ranks of those 19 founding members already supporting me at the highest level of membership. As a Founding Member, you’re not just backing this work—you’re also helping cover access fees for those who can’t afford it, such as students and the unemployed.
You’ll be making a real impact, helping me continue to challenge the system and push for better outcomes in healthcare through AI, technology, policy, and beyond.
Thank you!
👉👉👉👉👉 Hi! My name is Sergei Polevikov. I’m an AI researcher and a healthcare AI startup founder. In my newsletter ‘AI Health Uncut,’ I combine my knowledge of AI models with my unique skills in analyzing the financial health of digital health companies. Why “Uncut”? Because I never sugarcoat or filter the hard truth. I don’t play games, I don’t work for anyone, and therefore, with your support, I produce the most original, the most unbiased, the most unapologetic research in AI, innovation, and healthcare. Thank you for your support of my work. You’re part of a vibrant community of healthcare AI enthusiasts! Your engagement matters. 🙏🙏🙏🙏🙏
AI scribes do help. EMRs brought with them a second job that physicians have to do of frantically typing as they think. It takes energy and doing two jobs at once at a rapid pace is what leads to burnout. If leaders are looking only at productivity ROI, they should be prepared for clinician turnover. An AI scribe can be looked at as a way to extend the clinical careers of the current group of physicians.